This is the title of the presentation
========================================================
author: Mahbubul Majumder
date: Nov 13, 2014
width: 1340
height: 900
First Slide with external picture
========================================================
- Notice in the source codes how this picture is added here.
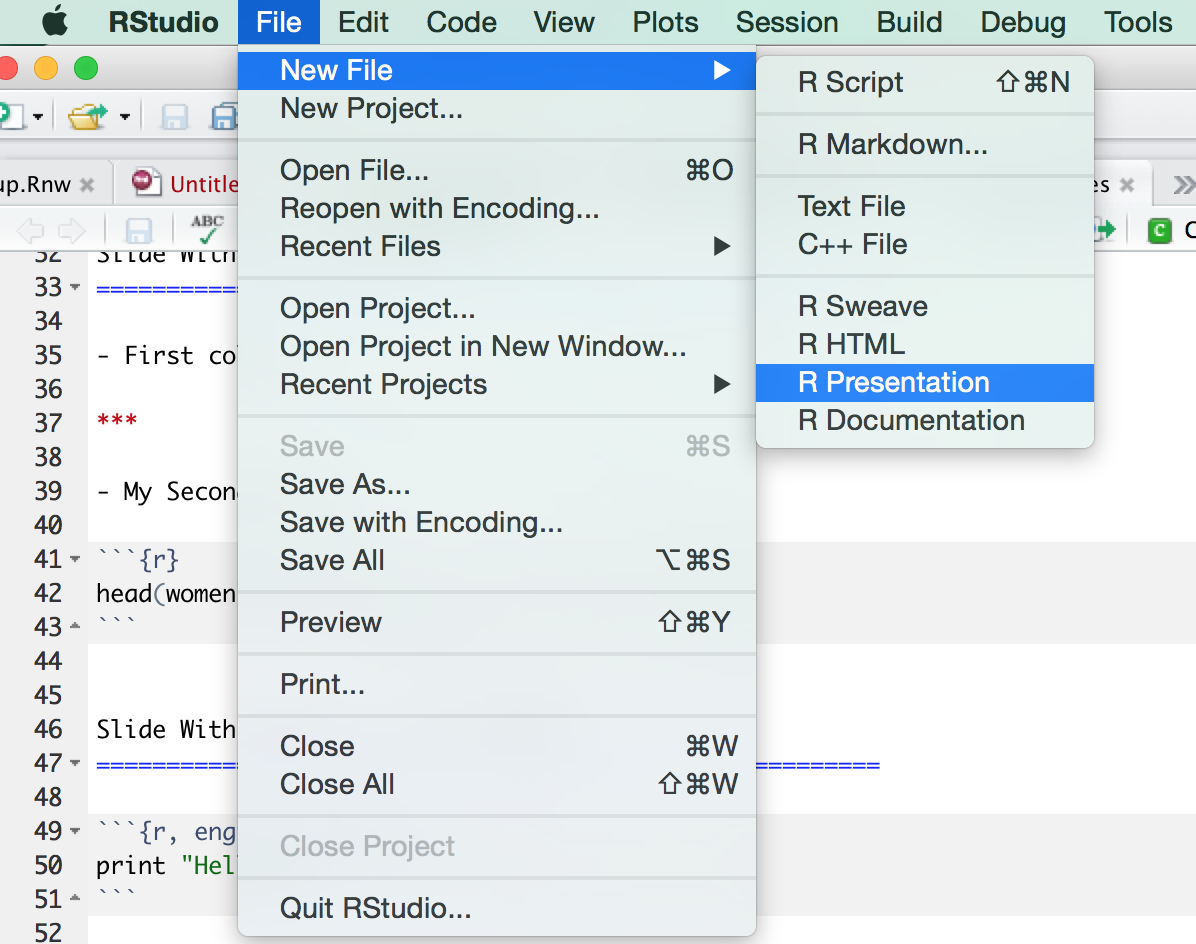
- This picture shows how to create this presentation from RStudio
- new file will start with a minimal reproducible presentations
Slide with Bullet Points
========================================================
For more details on authoring R presentations click the
**Help** button on the toolbar.
- Bullet 1 required a space after `-` sign
+ sub bullet
* sub-sub bullet required three more spaces
- Bullet 2. Try to keep bullets simple
- Bullet 3. Try not to write bullet more than a line
- bullet does not have to be a complete sentence
Slide With R Code
========================================================
```{r}
summary(cars)
```
Slide With python or Linux command
========================================================
- This is a `python` command. Notice how we changed the engine to `python`
```{r, engine='python'}
print "Hellow R"
```
- This is a `Linux` command. Notice how we changed the engine to `bash`
```{r, engine='bash'}
pwd
```
- You can use other commands like `C`, `awk` etc.
Slide With Plot
========================================================
- Notice how the size of the plot is set
```{r, echo=FALSE, fig.height=5, dpi=150}
plot(cars)
```
Slide With two columns
========================================================
left: 70%
- First column has a plot but no R code
```{r, echo=FALSE, fig.height=5, dpi=150}
plot(women)
```
- Notice the first column is wider since left is set to be 70%
***
- My Second column shows R code with results
```{r}
head(women)
```
- second column is narrow
- but why?
Slide with a table created from dataframe
========================================================
- This will show the head of dataframe mtcars in a table
```{r, results='asis'}
library(knitr)
kable(head(mtcars), format="html")
```
Slide with a user defined table
========================================================
- Notice in the codes, how this table is generated
|package| functions|
|-------|-----|
|base| sample, union, intersect, rbind, unique, merge|
|plyr| mutate, transmute|
|reshape2| melt, dcast|
|plyrmr| bind.cols, transmute, select, where, count.cols, quantile.cols, top.k, bottom.k|
Slide with math equation
========================================================
The normal distribution can be written as
$$f(x)=\frac1{\sqrt{2\pi \sigma^2}} e^{-\frac1{2\sigma^2} (x-\mu)^2}$$
Symbolically we write $$X \sim N(\mu, \sigma^2)$$
Slide with HTML
========================================================
This is the first heading
This is the second heading
This is a paragraph. It contains some plain text. The color, font-size and font-family of the texts are changed using CSS style. To check the HTML codes and tags used for this you may need to review the source codes of this presentation.
Slide with D3
========================================================
- Notice in the source code, how the HTML tags are written to produce this d3 animation.
- the source could be found as .Rpres file
- you can find it on [github](https://github.com/mamajumder/html-presentation)
Save presentation as HTML
========================================================
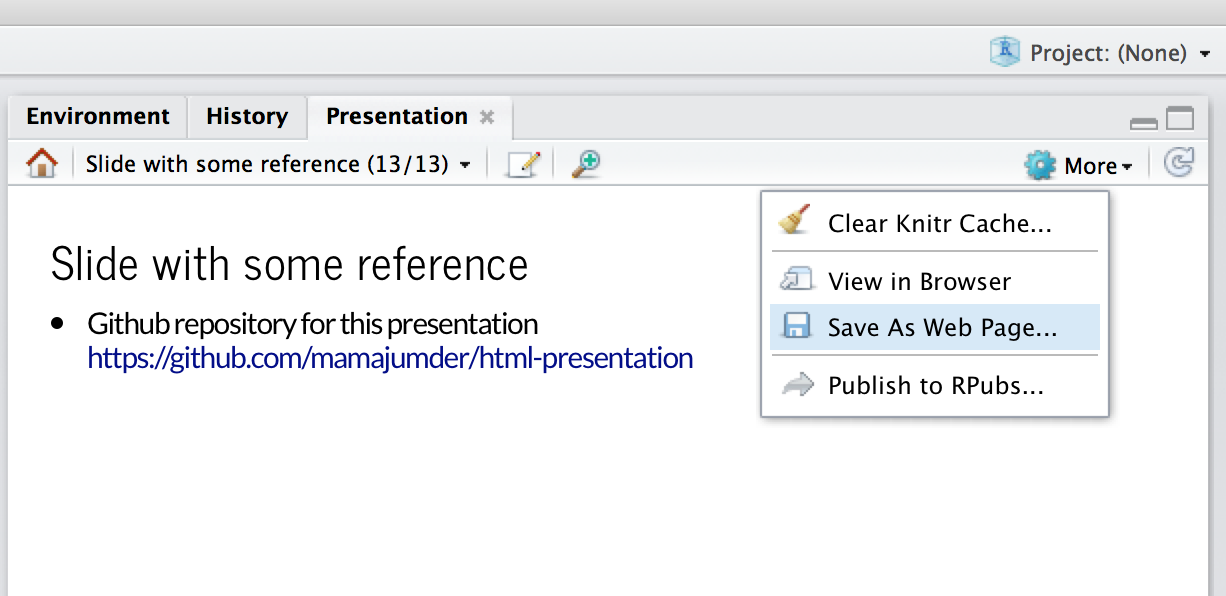
- At top right corner of RStudio, click on `More`, you will find the following options to save the presentation as HTML document.
Slide with some reference
========================================================
- Github repository for this presentation https://github.com/mamajumder/html-presentation
- Authoring R presentation https://support.rstudio.com/hc/en-us/articles/200486468
- For markdown documentation http://daringfireball.net/projects/markdown/syntax
- Details about ioslides presentation using markdown http://rmarkdown.rstudio.com/ioslides_presentation_format.html